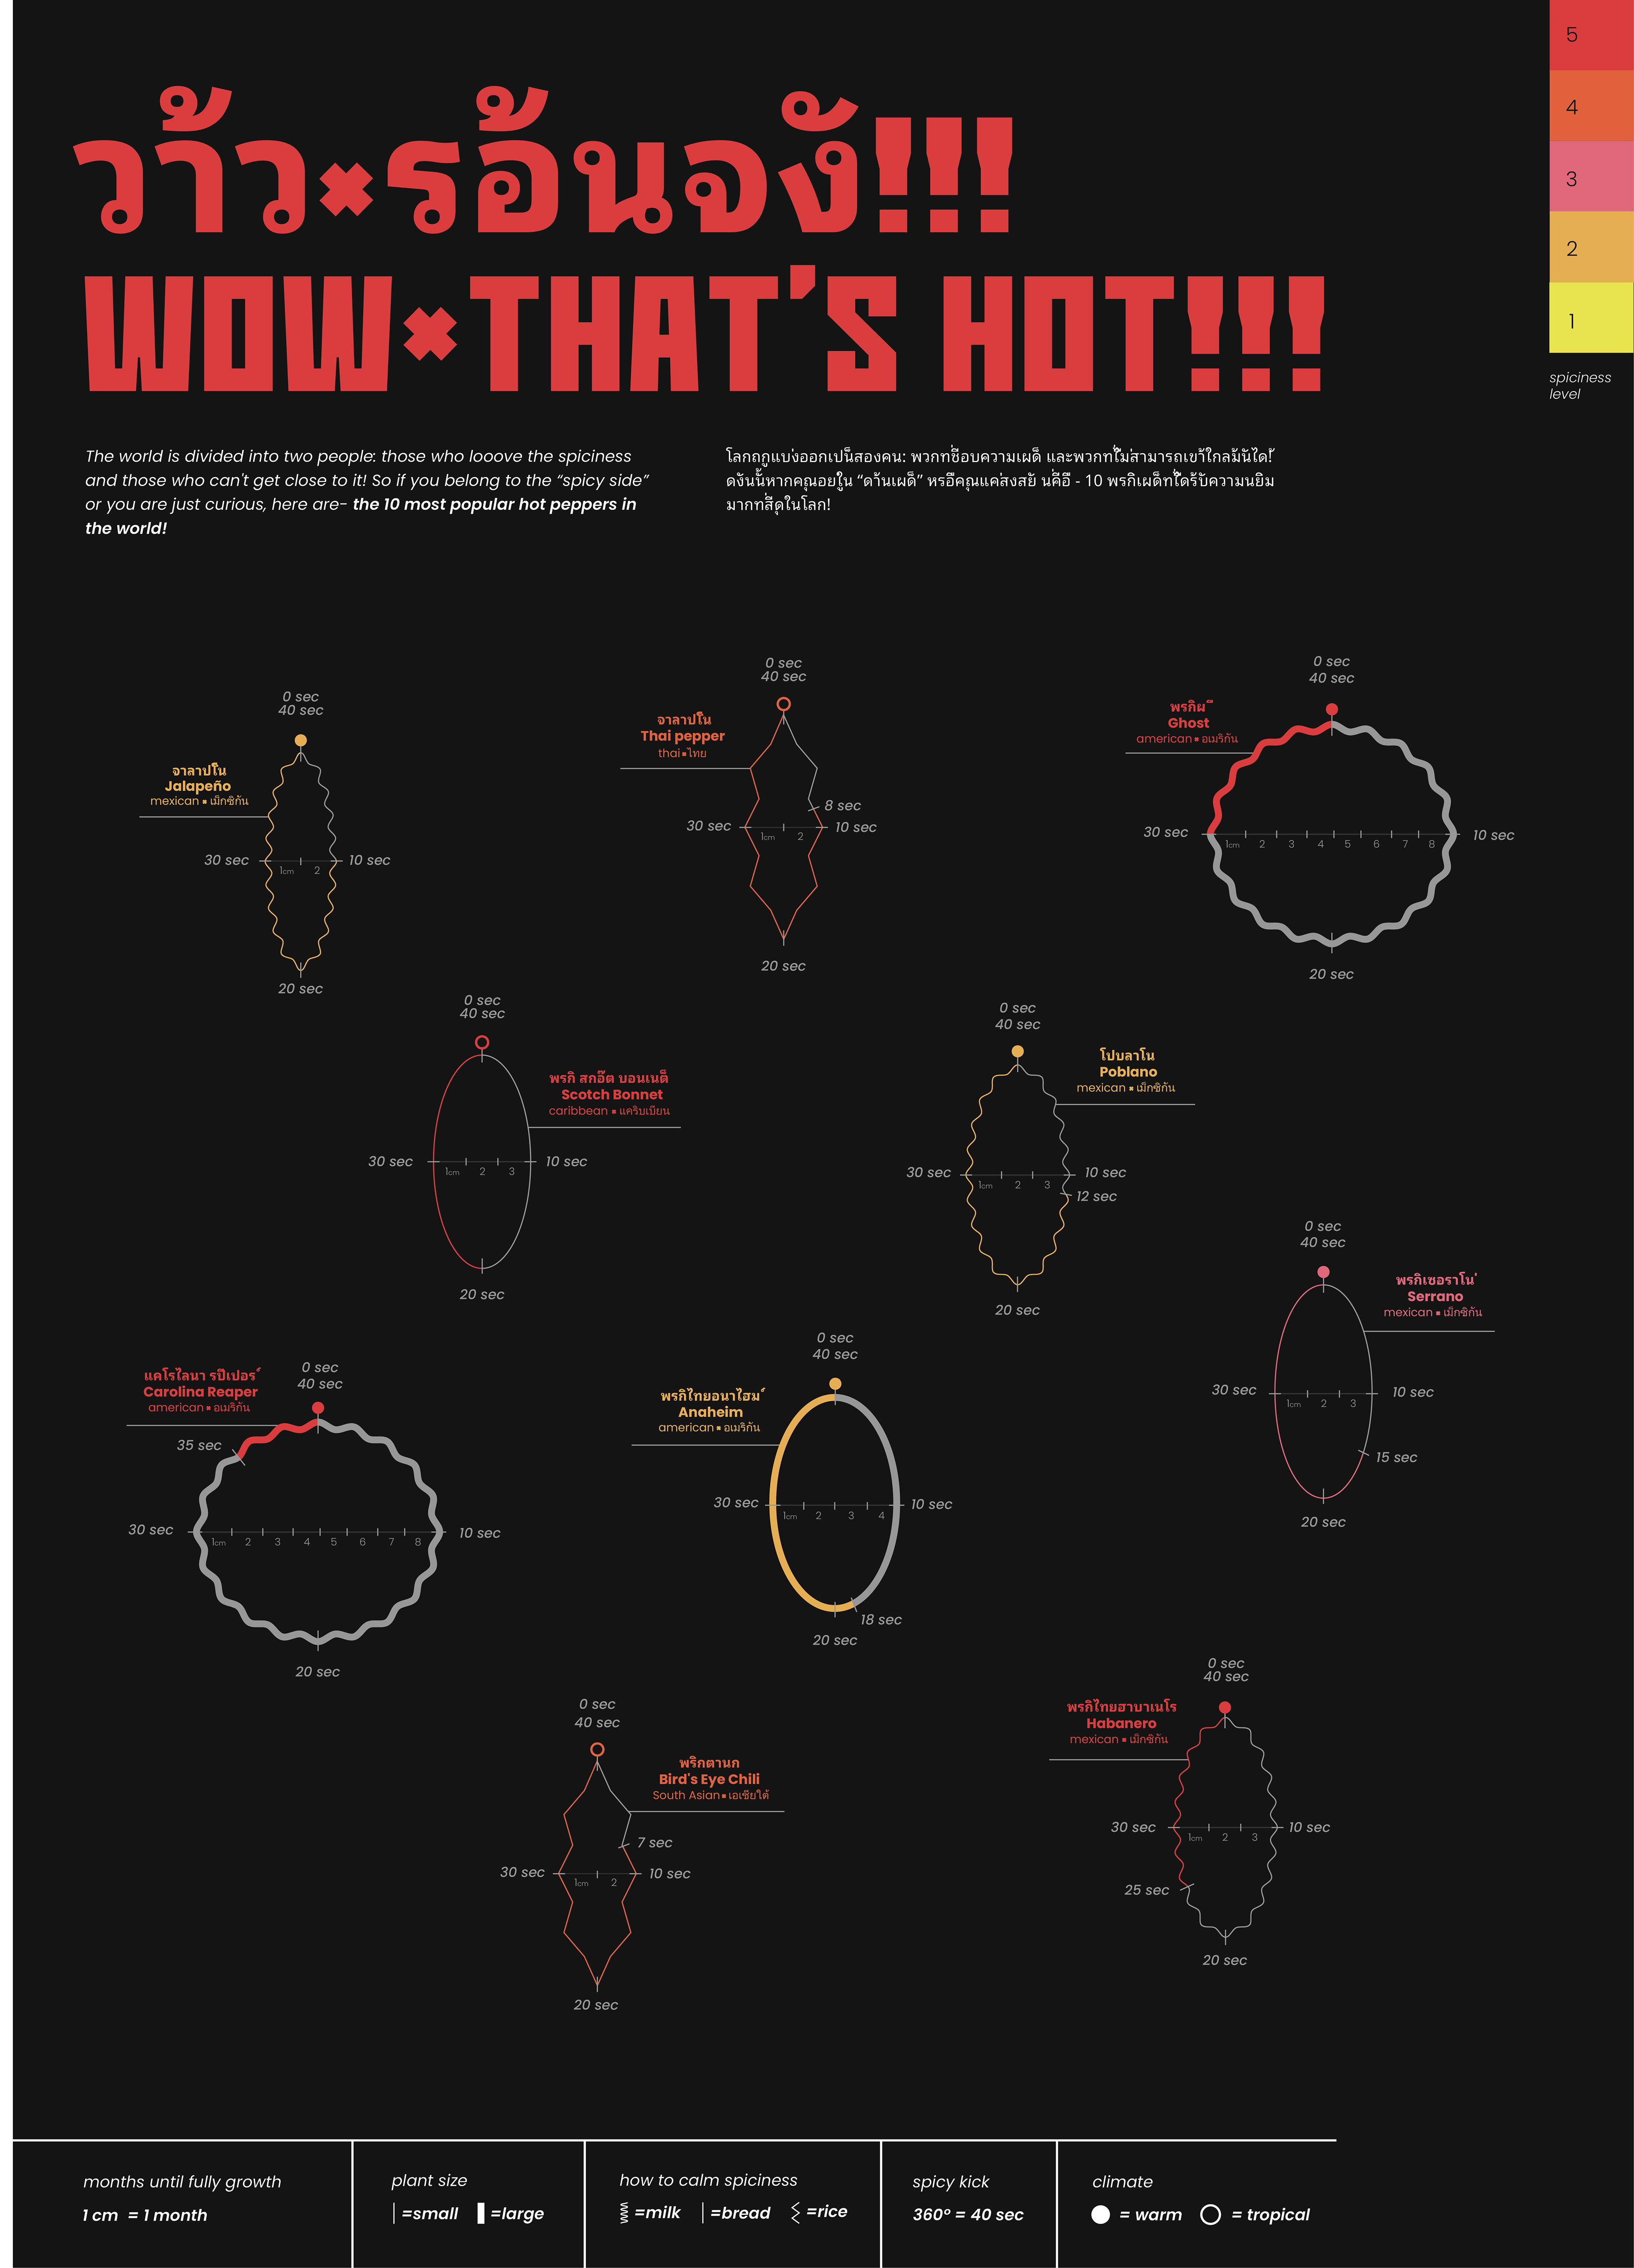
In this project, I explored data visualization through the analysis of 10 different types of the world’s hottest peppers. Leveraging AI (ChatGPT) for data collection, I gathered detailed information on each pepper, including factors such as heat level (measured in Scoville units), origin, and flavor profile. I then categorized the data and designed a custom visualization that highlighted key insights, such as the ranking of peppers by heat and geographic distribution. The process not only honed my skills in data analysis and visualization but also allowed me to experiment with how AI can be used to streamline research and create visually compelling narratives from complex datasets.